Third-party scripts on the Polish web: who loads what
7 in 10 Polish homepages load scripts from Google and 1 in 6 still loads Universal Analytics. Sites with more third parties respond slower on phones.


Seven in ten Polish homepages load scripts from Google, and four in five load a script from at least one third party. We read the homepages of the 7,785 .pl sites in the Tranco list of popular sites (opens in a new tab) that answered with HTML, the same list behind our study of Core Web Vitals by ecommerce platform, and named the companies behind most of the scripts they load. The median homepage loads code from 2 third parties, and 16% still load Universal Analytics, whose standard version stopped processing data (opens in a new tab) in July 2023.
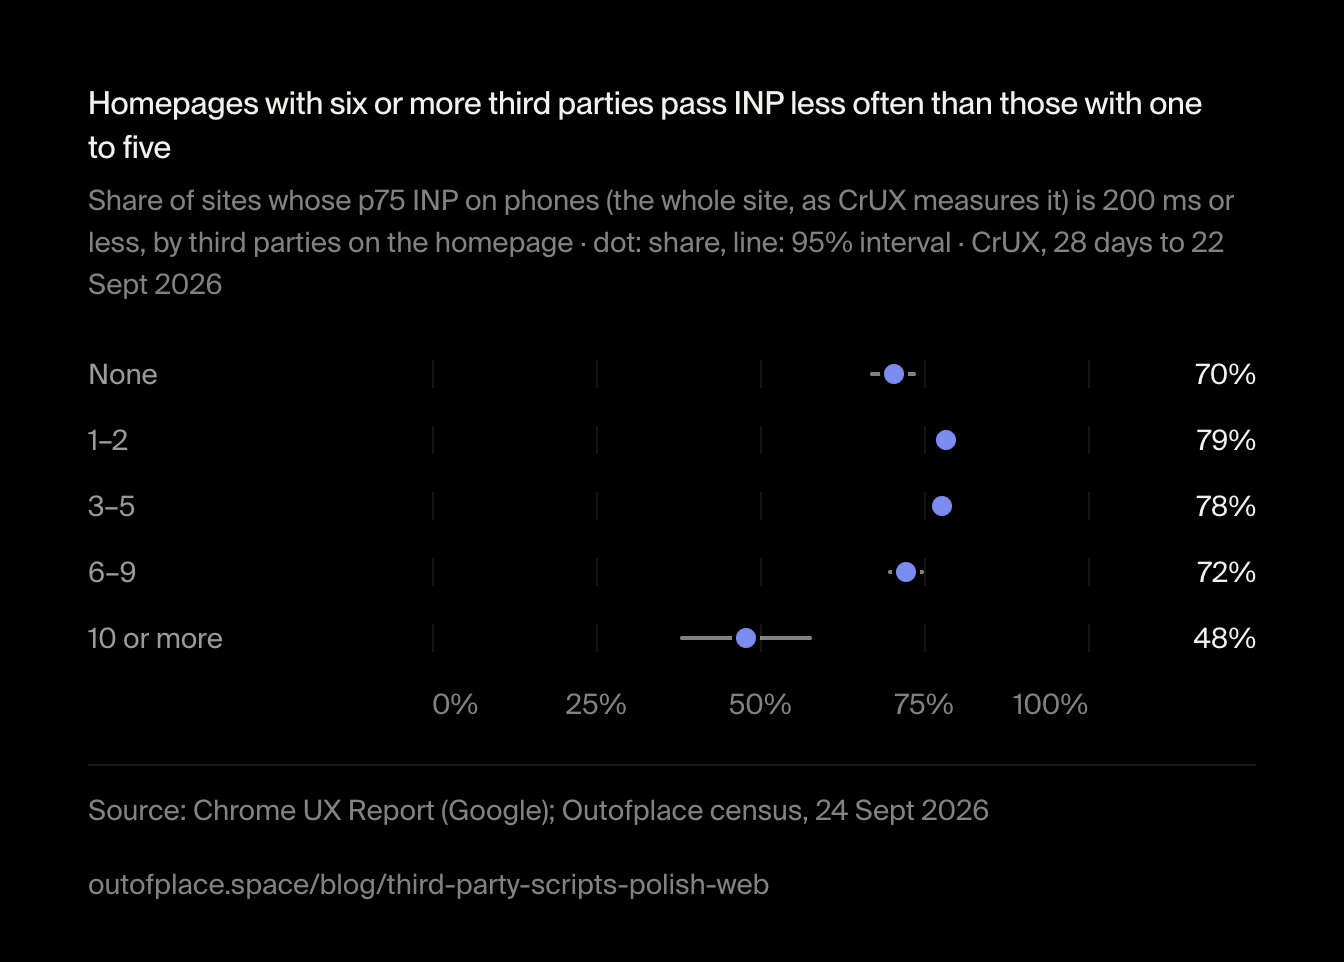
Then we looked the sites up in the Chrome UX Report (opens in a new tab), Google's record of how fast sites are for real Chrome users. Sites whose homepages load more third parties respond more slowly on phones: 79% of those with one or two pass Interaction to Next Paint (opens in a new tab) (INP, the time a page takes to respond to a tap), but only 48% of those with ten or more. In online shops the drop is steeper; on other sites the share holds up to nine.
- 7,785
- 82%
- 70%
- 16%
What are third-party scripts?
A third-party script is JavaScript a page loads from a company other than the site's owner. Some do a job the visitor sees, such as a chat window, a map, a payment widget or a cookie banner; most report on the visitor to someone: analytics, ad pixels, heatmaps. Each one costs the browser a connection and some work on the main thread, the one that also answers taps. Google's guide to third-party JavaScript (opens in a new tab) warns that "CPU-intensive script parsing and execution can delay user interaction".
We count a third party once per homepage however many files it loads, whether a script tag points at its servers or an inline install snippet loads its code, as the usual snippets for Google Tag Manager or the Meta Pixel do. A script from another domain counts as a third party even when that domain belongs to the site's own group.
Which third-party scripts Polish sites load
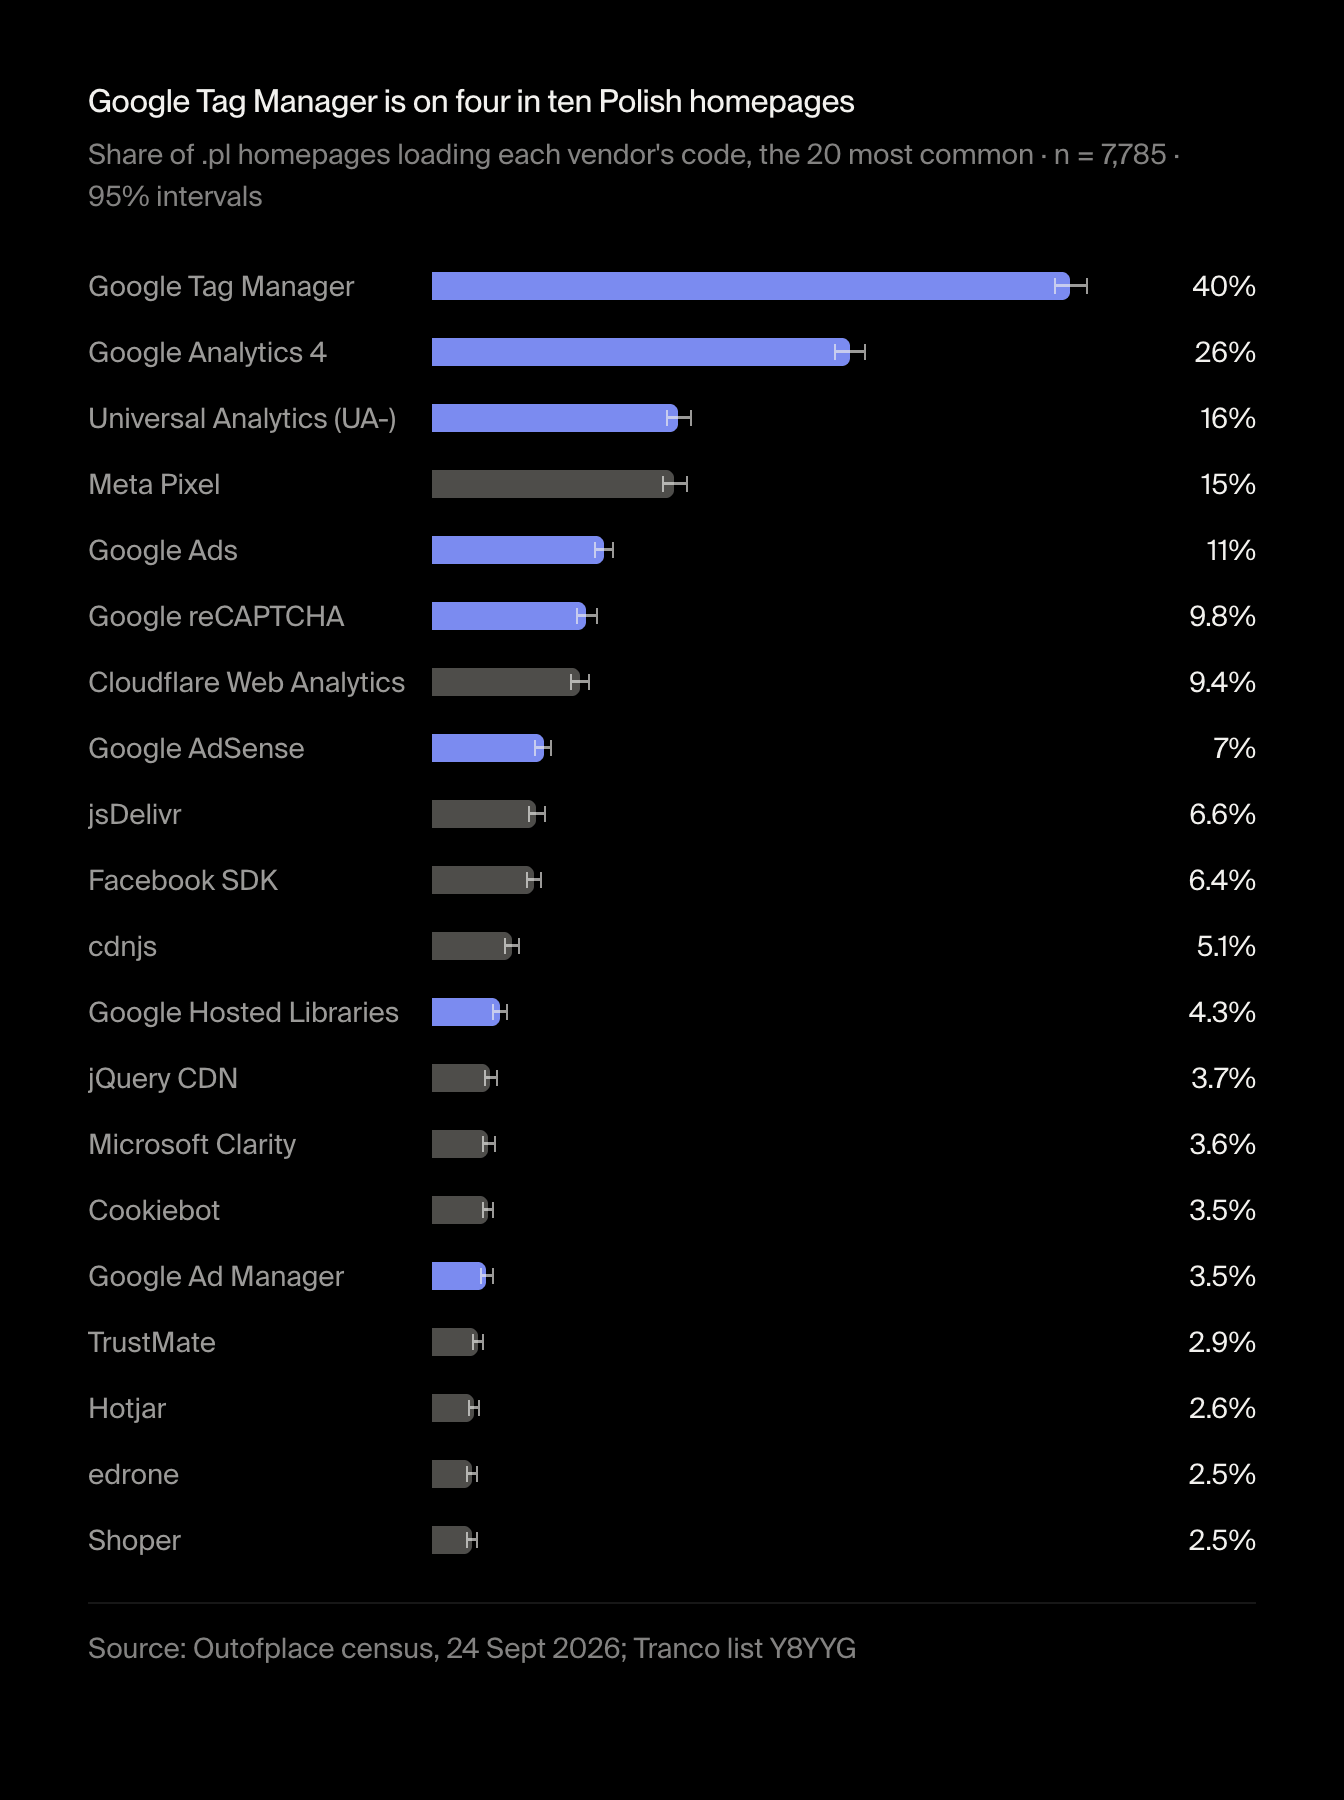
Google's tags lead by a distance: Google Tag Manager alone is on 40% of homepages. The Meta Pixel is the most common tag from anyone else, on 15%. Cloudflare's Web Analytics beacon ranks high too: Cloudflare adds it by default (opens in a new tab) to sites it proxies once the owner turns Web Analytics on (as of 24 September 2026).
Google Tag Manager is on four in ten Polish homepages
Share of .pl homepages loading each vendor's code, the 20 most common · n = 7,785 · 95% intervals
Show the data
| Item | Value | 95% interval | n |
|---|---|---|---|
| Google Tag Manager | 40% | 39%–41% | 7,785 |
| Google Analytics 4 | 26% | 25%–27% | 7,785 |
| Universal Analytics (UA-) | 16% | 15%–16% | 7,785 |
| Meta Pixel | 15% | 15%–16% | 7,785 |
| Google Ads | 11% | 10%–12% | 7,785 |
| Google reCAPTCHA | 9.8% | 9.1%–10% | 7,785 |
| Cloudflare Web Analytics | 9.4% | 8.7%–10% | 7,785 |
| Google AdSense | 7% | 6.5%–7.6% | 7,785 |
| jsDelivr | 6.6% | 6.1%–7.2% | 7,785 |
| Facebook SDK | 6.4% | 5.9%–7% | 7,785 |
| cdnjs | 5.1% | 4.6%–5.6% | 7,785 |
| Google Hosted Libraries | 4.3% | 3.8%–4.7% | 7,785 |
| jQuery CDN | 3.7% | 3.3%–4.1% | 7,785 |
| Microsoft Clarity | 3.6% | 3.2%–4% | 7,785 |
| Cookiebot | 3.5% | 3.1%–3.9% | 7,785 |
| Google Ad Manager | 3.5% | 3.1%–3.9% | 7,785 |
| TrustMate | 2.9% | 2.5%–3.3% | 7,785 |
| Hotjar | 2.6% | 2.3%–3% | 7,785 |
| edrone | 2.5% | 2.2%–2.9% | 7,785 |
| Shoper | 2.5% | 2.2%–2.9% | 7,785 |
The chart as an image, free to reuse under CC BY 4.0 with credit to Outofplace and a link to this page.
These are floors. A tag manager loads other tags after the page arrives, and those never appear in the HTML: a homepage with Google Tag Manager may well run Google Analytics, the Meta Pixel and a heatmap through it, and here it counts as one third party.
One homepage in six still loads Universal Analytics
Google replaced Universal Analytics with Google Analytics 4, and standard Universal Analytics properties stopped processing data on 1 July 2023. The tag that reports to them (a UA- ID, through gtag.js, analytics.js or the even older ga.js) still downloads and runs on every visit, though Google no longer processes its data.
- 1,213
- 616
- 14
On 616 homepages (7.9% of all) the dead tag is the only Google analytics in the HTML: no Google Analytics 4, Google tag or Tag Manager beside it. Google Optimize (opens in a new tab), Google's A/B testing tool switched off on 30 September 2023, is still on 14 homepages.
What the scripts are for: analytics, tag managers, ads
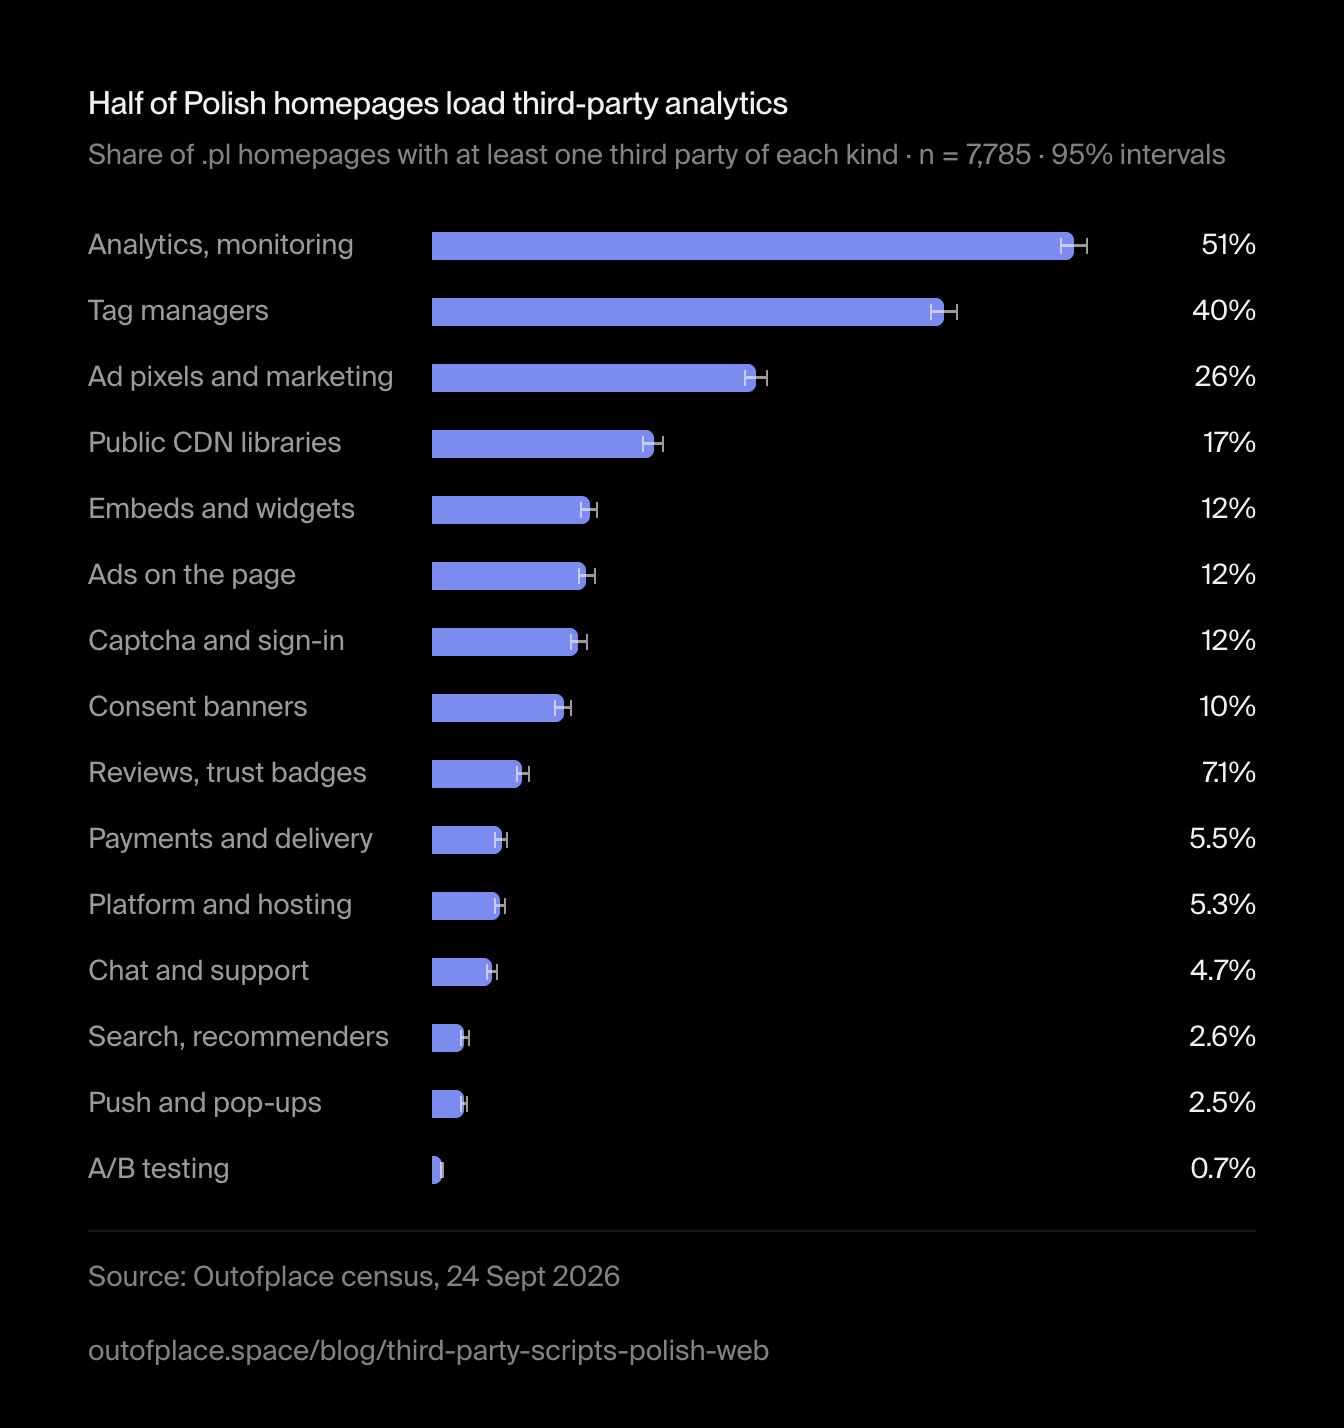
Grouped by the job they do, third-party analytics leads (51% of homepages), then tag managers (40%). Ad pixels and marketing automation, the tags that report visits and sales to advertisers, are on 26%.
Half of Polish homepages load third-party analytics
Share of .pl homepages with at least one third party of each kind · n = 7,785 · 95% intervals
Show the data
| Item | Value | 95% interval | n |
|---|---|---|---|
| Analytics, monitoring | 51% | 50%–52% | 7,785 |
| Tag managers | 40% | 39%–42% | 7,785 |
| Ad pixels and marketing | 26% | 25%–27% | 7,785 |
| Public CDN libraries | 17% | 17%–18% | 7,785 |
| Embeds and widgets | 12% | 12%–13% | 7,785 |
| Ads on the page | 12% | 12%–13% | 7,785 |
| Captcha and sign-in | 12% | 11%–12% | 7,785 |
| Consent banners | 10% | 9.7%–11% | 7,785 |
| Reviews, trust badges | 7.1% | 6.6%–7.7% | 7,785 |
| Payments and delivery | 5.5% | 5%–6% | 7,785 |
| Platform and hosting | 5.3% | 4.8%–5.8% | 7,785 |
| Chat and support | 4.7% | 4.2%–5.2% | 7,785 |
| Search, recommenders | 2.6% | 2.2%–2.9% | 7,785 |
| Push and pop-ups | 2.5% | 2.2%–2.9% | 7,785 |
| A/B testing | 0.7% | 0.6%–1% | 7,785 |
The chart as an image, free to reuse under CC BY 4.0 with credit to Outofplace and a link to this page.
Only 10% load a consent banner from a consent platform's servers, such as Cookiebot (3.5%). That doesn't mean the rest ask no one: a banner served from the site's own domain, such as a plugin for the site's CMS, isn't a third party and isn't counted here. Of all the vendor detections, 3.6% had every script held back in the HTML until consent or a delayed-loading plugin lets it run.
How many third parties a homepage loads
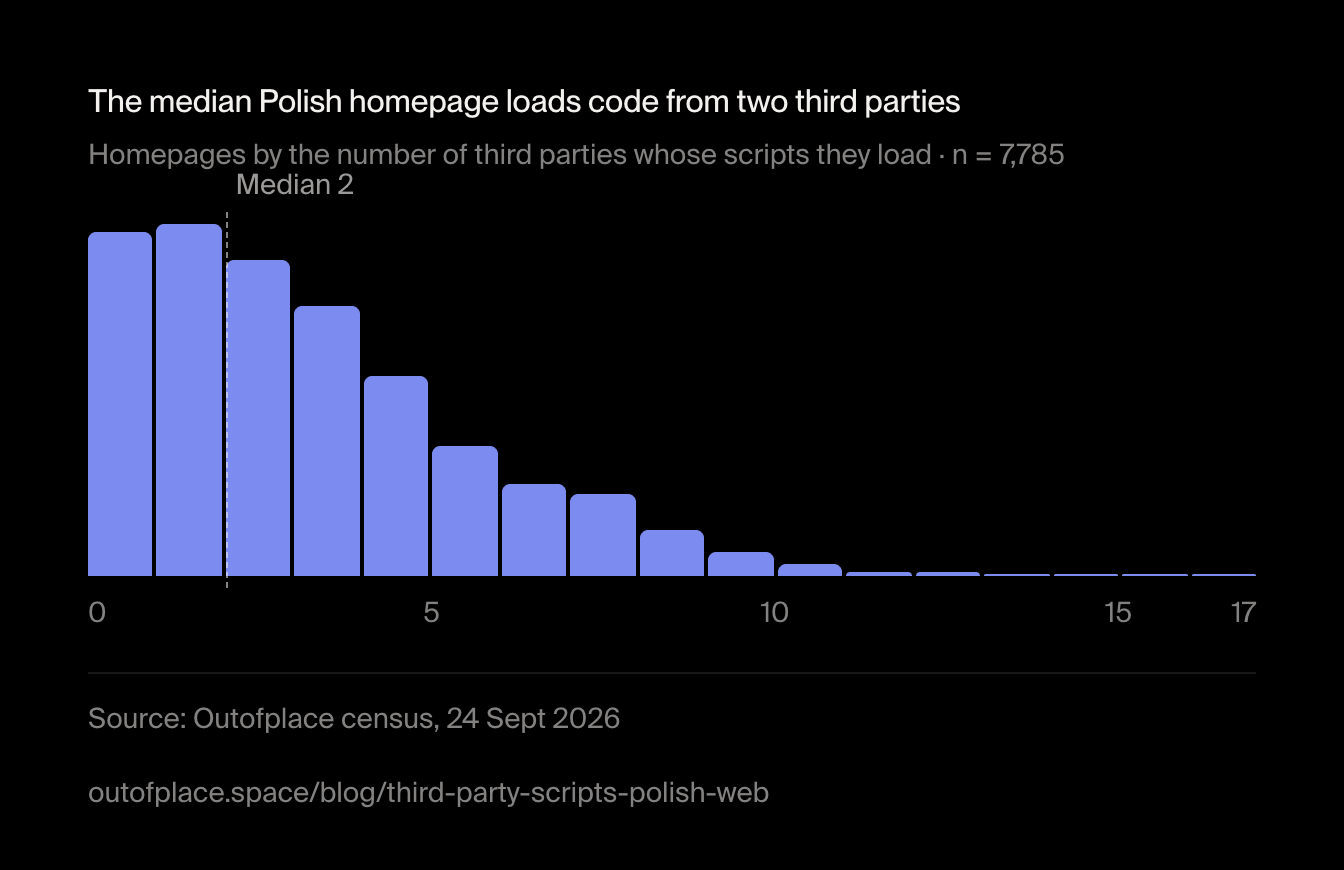
Most load a few: the median homepage loads code from 2 third parties. 18% load no third-party script at all, and only 1.2% load ten or more.
The median Polish homepage loads code from two third parties
Homepages by the number of third parties whose scripts they load · n = 7,785
Show the data
| Range | homepages |
|---|---|
| 0–1 | 1,423 |
| 1–2 | 1,462 |
| 2–3 | 1,314 |
| 3–4 | 1,123 |
| 4–5 | 829 |
| 5–6 | 537 |
| 6–7 | 383 |
| 7–8 | 339 |
| 8–9 | 190 |
| 9–10 | 94 |
| 10–11 | 50 |
| 11–12 | 14 |
| 12–13 | 11 |
| 13–14 | 7 |
| 14–15 | 3 |
| 15–16 | 5 |
| 16–17 | 1 |
The chart as an image, free to reuse under CC BY 4.0 with credit to Outofplace and a link to this page.
Do third-party scripts slow a site down?
Each script is work for the phone. To see whether real users feel it, we matched the homepages with the Chrome UX Report, which has data for 79% of the sites; the rest get too little Chrome traffic.
The more third parties, the less often a site passes INP, that is, responds to a tap within the 200 ms Google counts as good. Between one and five third parties the difference is small. From six the share drops, and at ten or more only about one site in two passes.
Homepages with six or more third parties pass INP less often than those with one to five
Share of sites whose p75 INP on phones (the whole site, as CrUX measures it) is 200 ms or less, by third parties on the homepage · dot: share, line: 95% interval · CrUX, 28 days to 22 Sept 2026
Show the data
| Item | Value | Range | n |
|---|---|---|---|
| None | 70% | 67%–74% | 647 |
| 1–2 | 79% | 77%–80% | 2,042 |
| 3–5 | 78% | 76%–79% | 2,194 |
| 6–9 | 72% | 69%–75% | 959 |
| 10 or more | 48% | 38%–58% | 90 |
The chart as an image, free to reuse under CC BY 4.0 with credit to Outofplace and a link to this page.
The response time itself climbs too. The typical (median) site has an INP of 129ms with one or two third parties and 202ms with ten or more, just past the edge of a good score.
From one or two third parties up, the typical site responds more slowly
Median p75 INP on phones (the whole site, as CrUX measures it) by third parties on the homepage · dot: median, line: the middle half of sites · shading: Google's thresholds · CrUX, 28 days to 22 Sept 2026
Show the data
| Item | Value | Range | n |
|---|---|---|---|
| None | 143ms | 94ms–213ms | 647 |
| 1–2 | 129ms | 96ms–188ms | 2,042 |
| 3–5 | 145ms | 111ms–193ms | 2,194 |
| 6–9 | 159ms | 128ms–206ms | 959 |
| 10 or more | 202ms | 161ms–252ms | 90 |
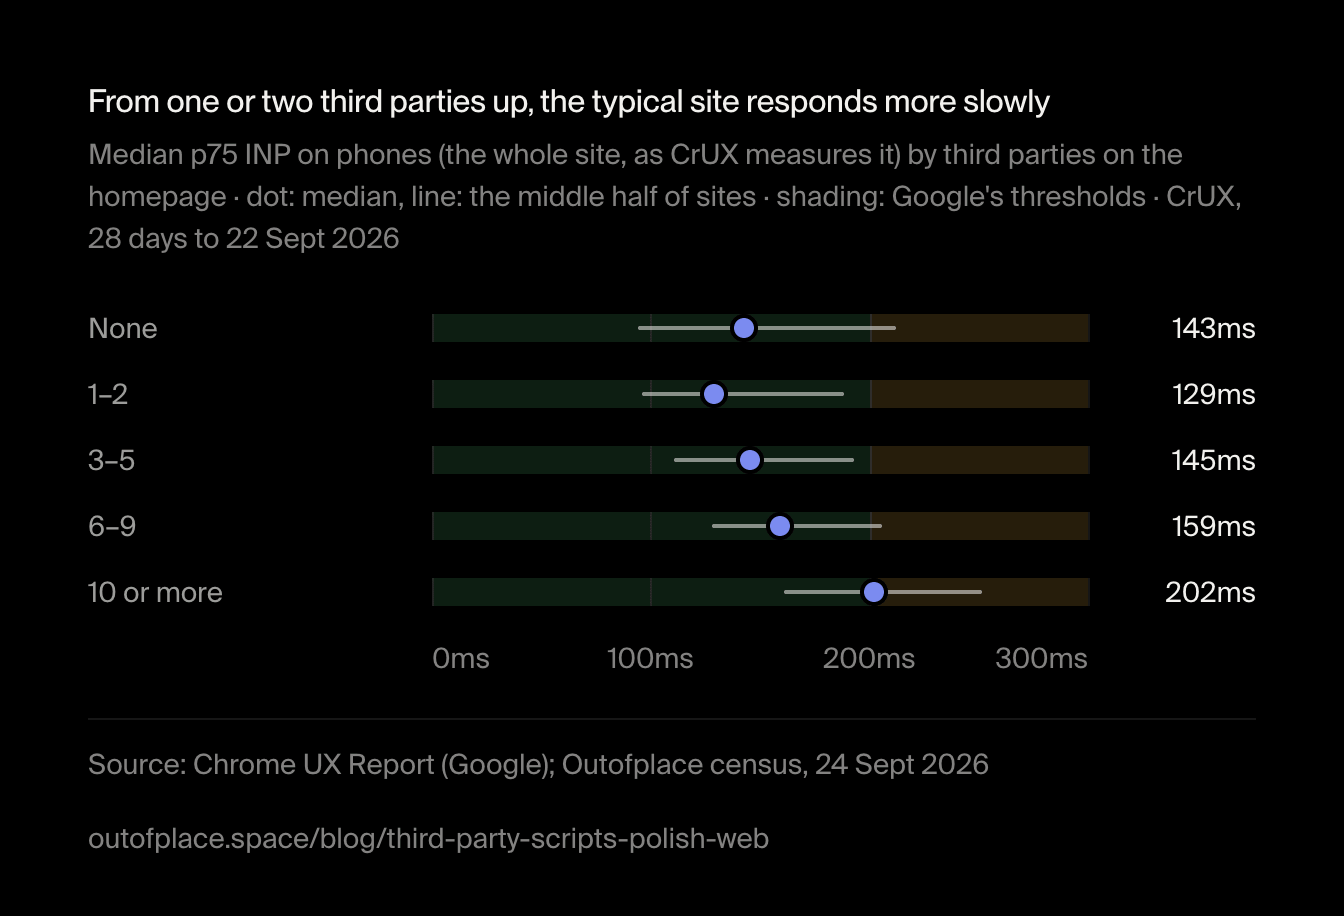
The chart as an image, free to reuse under CC BY 4.0 with credit to Outofplace and a link to this page.
Homepages with no third party at all break the pattern: only 70% of them pass. The group is a different one, though. Only 50% of them are in CrUX at all, against 76% of those with one or two third parties, so they are probably mostly smaller sites, where a slow INP may have other causes.
In shops the drop starts at six third parties
Shops and other sites behave differently. In shops the share passing INP drops from six third parties, and at ten or more only 44% of them pass (61 shops with data, so the interval is wide). On other sites the line stays nearly flat up to nine; too few of them load ten or more to say anything about those.
In shops, the drop in INP starts at six third parties
Share of sites passing INP on phones (the whole site, as CrUX measures it), shops against other sites, by third parties on the homepage · groups with at least 30 sites of each · CrUX, 28 days to 22 Sept 2026
- Shops
- Other sites
Show the data
| Item | Shops | Other sites |
|---|---|---|
| None | 67% | 71% |
| 1–2 | 79% | 78% |
| 3–5 | 77% | 78% |
| 6–9 | 65% | 79% |
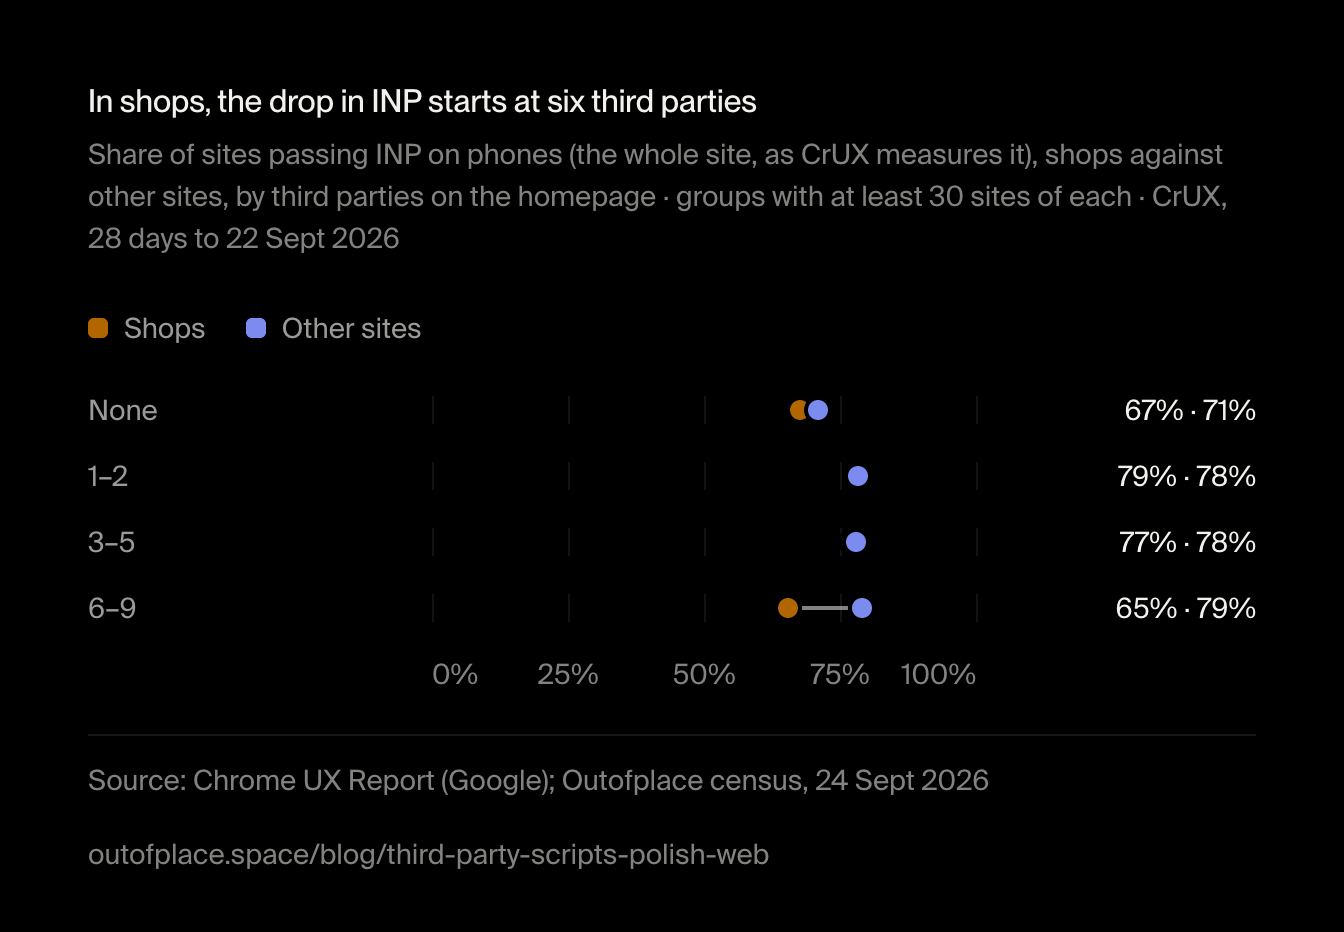
The chart as an image, free to reuse under CC BY 4.0 with credit to Outofplace and a link to this page.
We didn't split shops by platform. A platform that serves its code from another domain goes with a lower pass rate (below), so part of the drop may be the platform rather than the count.
Which kinds of script go with a slower site
6 kinds make no difference within the margin of error: sites with a tag manager, ad pixels, a consent banner, push notifications, payments and delivery, or embeds pass INP about as often as sites without. 6 kinds go with a lower pass rate: A/B testing (on few sites), third-party search or recommendations, platform code served from another domain, review widgets, a chat and ads. The other 3, third-party analytics, CDN libraries and captchas, go with a slightly higher one.
A/B testing, third-party search and review widgets go with a lower INP pass rate; tag managers don't
Share of sites passing INP on phones (the whole site, as CrUX measures it), homepages with each kind of third party against those without · CrUX, 28 days to 22 Sept 2026
- Sites with it
- Sites without it
Show the data
| Item | Sites with it | Sites without it | n |
|---|---|---|---|
| A/B testing | 47% | 76% | 55 |
| Search, recommenders | 57% | 77% | 197 |
| Platform and hosting | 61% | 77% | 390 |
| Reviews, trust badges | 67% | 77% | 538 |
| Chat and support | 71% | 76% | 324 |
| Ads on the page | 72% | 77% | 874 |
| Payments and delivery | 73% | 76% | 400 |
| Push and pop-ups | 75% | 76% | 193 |
| Consent banners | 75% | 76% | 737 |
| Ad pixels and marketing | 75% | 76% | 1,821 |
| Tag managers | 76% | 76% | 2,884 |
| Embeds and widgets | 78% | 76% | 834 |
| Public CDN libraries | 79% | 75% | 1,096 |
| Captcha and sign-in | 79% | 75% | 732 |
| Analytics, monitoring | 78% | 74% | 3,252 |
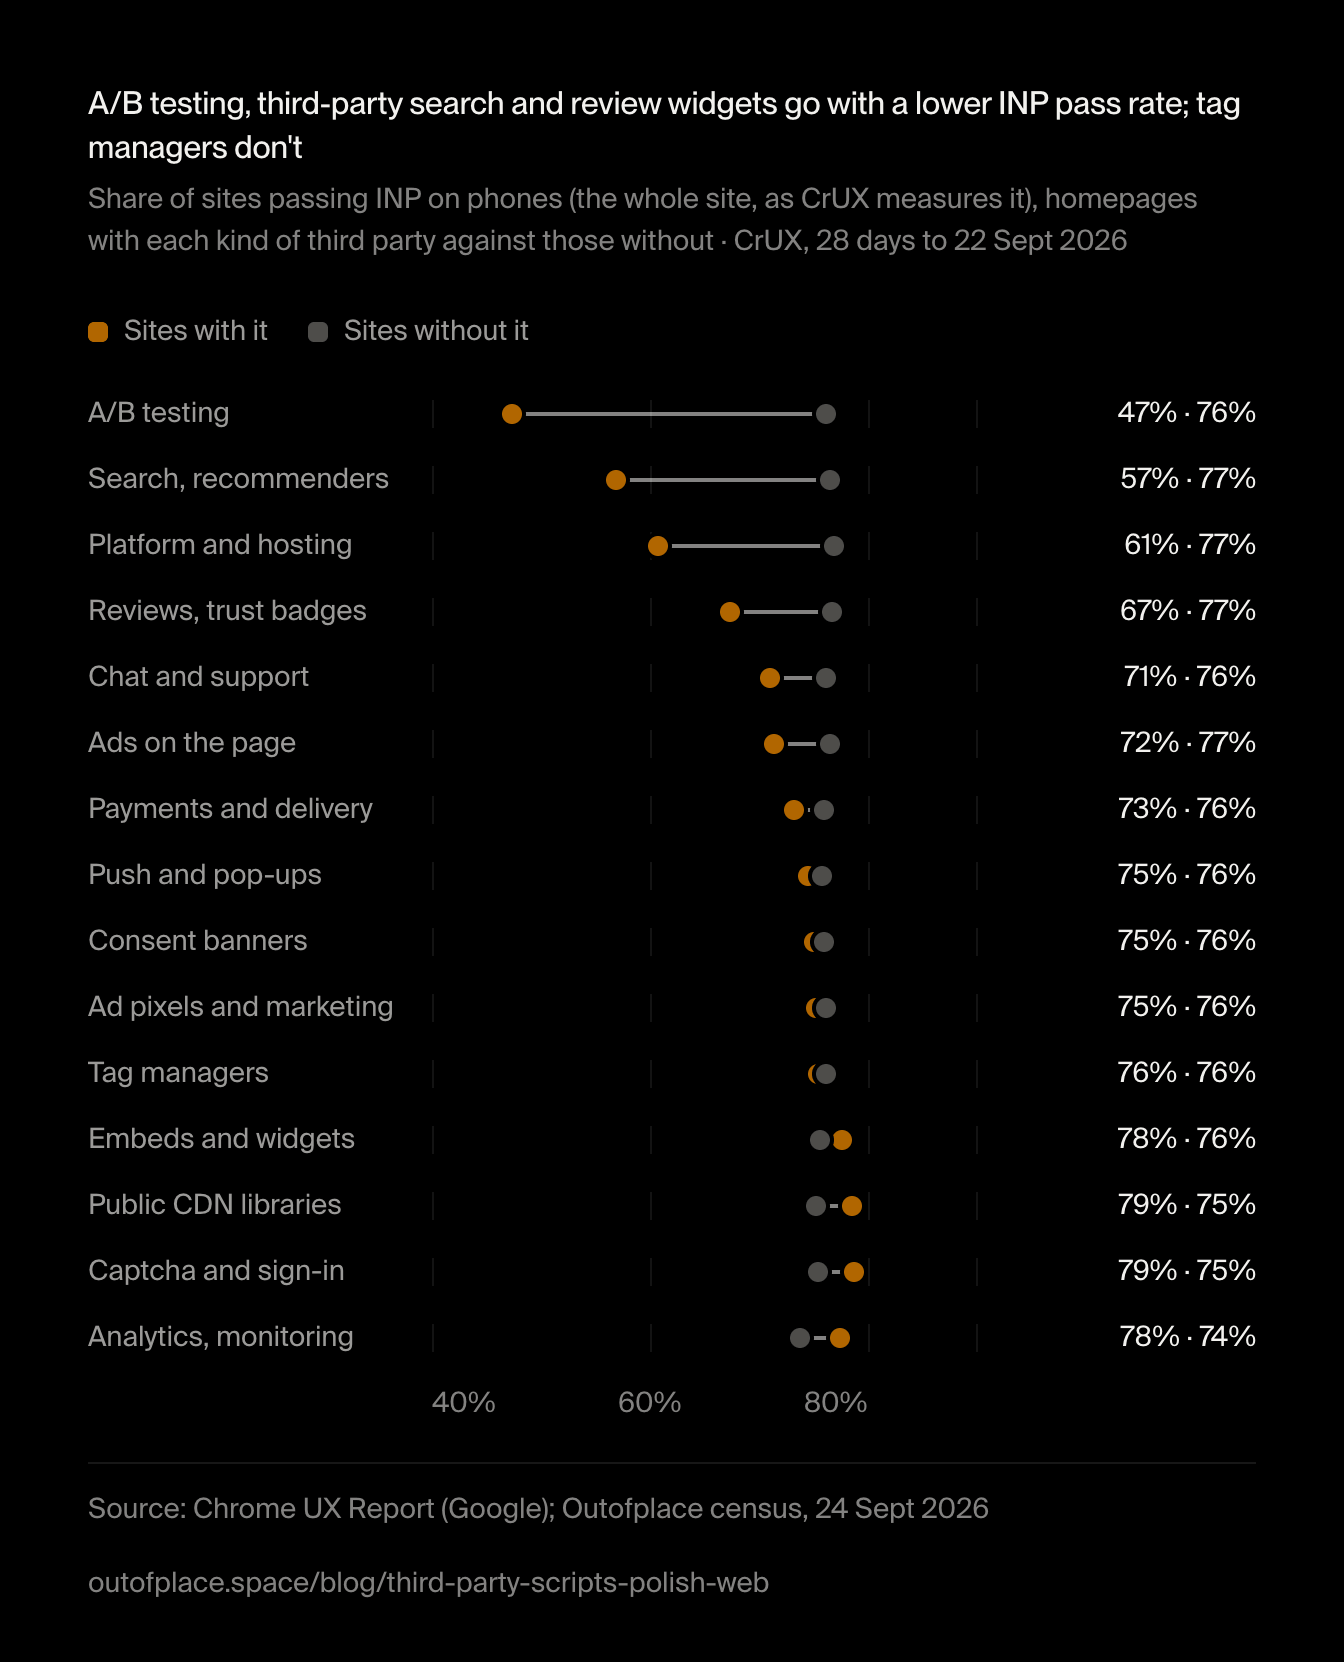
The chart as an image, free to reuse under CC BY 4.0 with credit to Outofplace and a link to this page.
Does Google Tag Manager slow down a site?
Not on its own, as far as the field data shows. Homepages with Google Tag Manager pass INP on phones 76% of the time, those without it 76%, a difference within the margin of error. What matters is what the container loads, and that doesn't show in the HTML. Google's own guide to tags and tag managers (opens in a new tab) says its authors "have seen a correlation between the size of tag managers and poorer INP scores" (read on 24 September 2026). So the question to ask is not whether a site uses a tag manager, but what is in it.
How to find and trim third-party scripts on your site
List what loads
Open your homepage in Chrome with DevTools, reload with the Network panel filtered to JS, and sort by domain. Everything not on your domain is a third party. Then open your tag manager: its tags load after the page and don't appear in the HTML.
Remove what is dead
Universal Analytics and Google Optimize tags do nothing now but still download and run. So do tags for campaigns that ended and tools nobody logs into. Google's guide to tags notes that pausing or removing a tag in Tag Manager removes its code from the container, while blocking it doesn't (as of 24 September 2026).
Load widgets when they are needed
A chat, a map or a video player can wait for the visitor to ask for it: show a button or a still image, and load the script on the first click.
Check your field data
Look up your site in PageSpeed Insights (opens in a new tab): if it has enough Chrome traffic, the top of the report shows the same CrUX data as this study. Start with INP, the metric that suffers when scripts keep the main thread busy; Google's guide to optimising INP (opens in a new tab) explains how to find the scripts behind a slow response.
Measure again after four weeks
CrUX covers a rolling 28 days, so a change shows in full only after four weeks.
| Vendor | Kind | Homepages | Share |
|---|---|---|---|
| Google Tag Manager | Tag managers | 3,140 | 40% |
| Google Analytics 4 | Analytics, monitoring | 2,055 | 26% |
| Universal Analytics (UA-) | Analytics, monitoring | 1,213 | 16% |
| Meta Pixel | Ad pixels and marketing | 1,191 | 15% |
| Google Ads | Ad pixels and marketing | 844 | 11% |
| Google reCAPTCHA | Captcha and sign-in | 759 | 9.8% |
| Cloudflare Web Analytics | Analytics, monitoring | 729 | 9.4% |
| Google AdSense | Ads on the page | 547 | 7% |
| jsDelivr | Public CDN libraries | 515 | 6.6% |
| Facebook SDK | Embeds and widgets | 500 | 6.4% |
| cdnjs | Public CDN libraries | 394 | 5.1% |
| Google Hosted Libraries | Public CDN libraries | 332 | 4.3% |
| jQuery CDN | Public CDN libraries | 287 | 3.7% |
| Microsoft Clarity | Analytics, monitoring | 279 | 3.6% |
| Cookiebot | Consent banners | 272 | 3.5% |
27 more rows
| Vendor | Kind | Homepages | Share |
|---|---|---|---|
| Google Ad Manager | Ads on the page | 270 | 3.5% |
| TrustMate | Reviews, trust badges | 223 | 2.9% |
| Hotjar | Analytics, monitoring | 203 | 2.6% |
| edrone | Ad pixels and marketing | 196 | 2.5% |
| Shoper | Platform and hosting | 195 | 2.5% |
| InPost (Pay, Geowidget) | Payments and delivery | 162 | 2.1% |
| Google tag (GT- ID) | Analytics, monitoring | 156 | 2% |
| TikTok Pixel | Ad pixels and marketing | 154 | 2% |
| Google Maps | Embeds and widgets | 152 | 2% |
| unpkg | Public CDN libraries | 152 | 2% |
| Trusted Shops | Reviews, trust badges | 128 | 1.6% |
| Shopify | Platform and hosting | 127 | 1.6% |
| Smartsupp | Chat and support | 124 | 1.6% |
| CookieYes | Consent banners | 112 | 1.4% |
| AlleKurier | Payments and delivery | 109 | 1.4% |
| OneTrust | Consent banners | 107 | 1.4% |
| Cloudflare Turnstile | Captcha and sign-in | 106 | 1.4% |
| Luigi's Box | Search, recommenders | 104 | 1.3% |
| Google APIs (platform.js) | Embeds and widgets | 103 | 1.3% |
| WP Pixel | Ad pixels and marketing | 97 | 1.3% |
| Klaviyo | Ad pixels and marketing | 93 | 1.2% |
| GetResponse | Ad pixels and marketing | 88 | 1.1% |
| optAd360 | Ads on the page | 87 | 1.1% |
| BootstrapCDN | Public CDN libraries | 85 | 1.1% |
| PushPushGo | Push and pop-ups | 84 | 1.1% |
| Font Awesome | Public CDN libraries | 83 | 1.1% |
| Microsoft Advertising (UET) | Ad pixels and marketing | 82 | 1.1% |
How we measured
How we checked the vendor table
For the 15 most common vendors we drew 8 detections each, in a fixed random order, and read the HTML behind every one. 119 of the 120 were right. The one miss was a consent banner whose script tag had typographic quotes in its type attribute, so the browser never runs it.
What this data can't tell you
We saw the homepage only, as its HTML arrived, and ran none of it: scripts that a tag manager or another script adds later are invisible, so every share here is a floor and the counts per homepage undercount sites with busy tag managers. A homepage longer than 1 MiB was cut there (331 of them). The field data covers every page of a site, not just the homepage, and only sites with enough Chrome traffic. Sites that load more third parties also differ in size, purpose and build, so none of the differences above shows that the scripts caused them.
What are third-party scripts?
JavaScript a page loads from a company other than the site's owner: a tag manager, an analytics or advertising tag, a chat widget, a consent banner, a library from a public CDN. In September 2026, 82% of the Polish homepages we read loaded code from at least one such company, and the median homepage from 2.
Does Google Tag Manager slow down a site?
Not measurably on its own in our data: 76% of Polish homepages with Google Tag Manager passed INP on phones, against 76% without it. What matters is what the container loads, which the page's HTML doesn't show. Google's web.dev team reports a correlation between the size of tag managers and poorer INP, so audit the tags inside it.
Google tag vs Google Tag Manager: what's the difference?
The Google tag (gtag.js) is one library that sends data to Google products such as Google Analytics 4 and Google Ads, identified by an ID like G-, AW- or GT-. Google Tag Manager is a container with a GTM- ID that loads any number of tags, Google's or anyone else's, which you set up in Tag Manager without changing the site's code.
Is Universal Analytics still working?
No. Google says standard Universal Analytics properties stopped processing data on 1 July 2023. The tag still loads and runs, but Google no longer processes its data: 16% of Polish homepages still carried one in September 2026, and 616 of them had no Google Analytics 4, Google tag or Tag Manager beside it.
How do I find the third-party scripts on my site?
Open the site in Chrome, open DevTools, reload with the Network panel filtered to JS and sort by domain: everything not on your own domain is a third party. Then open your tag manager and list what each container loads, since those scripts don't appear in the page's HTML.